Businesses today collect massive amounts of information from sales, customers, marketing campaigns, finance, operations, inventory, and other systems. While this data can provide valuable insights, turning it into clear and useful information can be challenging.
Traditional spreadsheets and static reports may work for basic requirements, but they can become difficult to manage as an organization grows.
This is where Power BI Service can help.
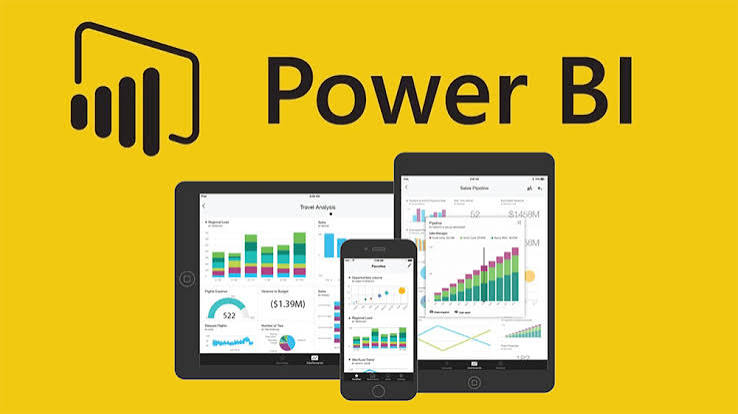
Power BI Service is Microsoft’s cloud-based business intelligence environment that enables organizations to work with interactive reports, dashboards, visualizations, and business data. It helps businesses share insights, monitor important metrics, and provide authorized users with access to reporting information.
For organizations in the USA and Canada, Power BI can simplify the process of turning complex datasets into visual insights that support everyday operations and strategic decisions.
In this article, we’ll explore 7 ways Power BI Service simplifies data visualization and reporting, along with the role of professional Power BI consulting, development, and managed services.
What Is Power BI Service?
Power BI Service is the cloud-based component of the Microsoft Power BI platform.
It allows organizations to publish, manage, share, and interact with reports and dashboards online.
Power BI Service works alongside Power BI Desktop and other Power BI capabilities to provide businesses with a broader business intelligence environment.
Organizations can use Power BI Service to:
- Create and view interactive dashboards
- Share reports with authorized users
- Monitor business KPIs
- Explore data visually
- Connect information from different sources
- Schedule data refreshes
- Create apps and workspaces
- Manage access to reports and dashboards
The main advantage is that business information can become easier to explore and understand without requiring every employee to be a data analyst.
1. Turns Complex Data Into Easy-to-Understand Visuals
Raw data can be difficult to interpret.
Imagine a spreadsheet containing tens of thousands of sales transactions. While the information may be valuable, finding meaningful patterns manually can take considerable time.
Power BI Service allows organizations to represent information through visualizations such as:
- Bar charts
- Line charts
- Pie and donut charts
- KPI cards
- Tables
- Maps
- Trend visualizations
- Interactive dashboards
For example, instead of looking at a spreadsheet to determine which region generates the most revenue, a business leader can view a visual comparison across regions.
This makes complex information easier to understand and can help users identify trends more quickly.
Why Visualization Matters
Effective visualization helps answer business questions.
Instead of simply showing:
$5 million in annual revenue
a dashboard could show:
$5 million in revenue → 18% year-over-year growth → strongest performance in the Western region.
That additional context can make the information much more useful for decision-makers.
2. Creates Interactive Reports Instead of Static Documents
Traditional reports often provide a fixed view of business information.
If someone wants additional information, they may need to request another report.
Power BI Service provides interactive reporting capabilities that allow users to explore information from different perspectives.
For example, a sales dashboard could allow users to filter results by:
- Product
- Region
- Customer
- Sales representative
- Date
- Industry
- Market
A manager can start with total sales and then explore the specific factors contributing to that result.
This reduces the need to create separate static reports for every analytical question.
3. Combines Data From Multiple Sources
Data fragmentation is one of the biggest challenges facing growing organizations.
Businesses may have information stored in:
- CRM systems
- ERP platforms
- Excel files
- SQL databases
- Accounting software
- Marketing platforms
- Cloud applications
- Internal systems
Analyzing each source separately can make it difficult to understand overall business performance.
Power BI supports connections to a broad range of data sources, allowing organizations to build reporting solutions around information from multiple systems.
For example, a business could combine sales, customer, and marketing data to understand how marketing activity affects revenue.
This provides a more complete picture than analyzing each dataset independently.
4. Makes KPI Reporting Simpler
Key performance indicators help businesses measure whether they are moving toward their objectives.
Common KPIs include:
- Revenue
- Profit margin
- Sales growth
- Conversion rate
- Customer retention
- Customer acquisition cost
- Inventory turnover
- Operating expenses
- Employee productivity
Power BI Service can bring important KPIs into centralized dashboards.
Instead of searching through several reports to find important numbers, decision-makers can see relevant metrics in one place.
This makes performance monitoring more straightforward.
Example of a KPI Dashboard
A management dashboard might display:
Revenue: $2.8M
Sales Growth: +14%
Customer Growth: +9%
Gross Margin: 38%
Target Achievement: 92%
The visual format makes it easier to identify which areas are performing well and which require attention.
5. Automates Repetitive Reporting Tasks
Manual reporting can be one of the most time-consuming administrative processes in a business.
Employees may repeatedly:
- Export information from different systems.
- Combine spreadsheets.
- Clean the data.
- Update formulas.
- Build charts.
- Format reports.
- Email reports to stakeholders.
Power BI can help automate parts of this workflow through data connections, reusable reports, dashboards, and configured refresh processes.
This can reduce repetitive work and allow employees to spend more time analyzing information.
For growing organizations, automation can also make reporting processes easier to scale.
6. Improves Collaboration Across Departments
Business reporting becomes more valuable when different teams can access relevant information.
Sales teams may need revenue data.
Finance may need profitability information.
Marketing may need campaign results.
Operations may need inventory and productivity metrics.
Executives may need organization-wide KPIs.
Power BI Service provides capabilities for sharing reports and dashboards with authorized users.
This can help departments work with a more consistent source of business information.
Instead of maintaining multiple versions of the same spreadsheet, organizations can establish centralized reports around common metrics.
This can improve communication and reduce confusion during business reviews.
7. Makes Business Intelligence Accessible From the Cloud
Modern businesses often have distributed teams.
Employees may work from corporate offices, remote locations, branch offices, or different states and provinces.
Because Power BI Service is cloud-based, authorized users can access reports and dashboards through the online service according to their organization’s configuration, licensing, security, and access policies.
For businesses operating across the USA and Canada, this can make it easier to distribute business intelligence across geographically dispersed teams.
Executives in one location can review performance while managers in another location investigate operational details.
This can create a more connected reporting environment.
Power BI Service for Different Business Departments
One of the strengths of Power BI is its flexibility.
Different departments can use the platform for different analytical requirements.
Sales Analytics
Sales teams can monitor:
- Revenue
- Sales targets
- Pipeline
- Conversion rates
- Regional performance
- Product performance
Marketing Analytics
Marketing teams can analyze:
- Campaign performance
- Leads
- Conversion rates
- Customer acquisition
- Marketing costs
- Channel performance
Financial Reporting
Finance teams can monitor:
- Revenue
- Expenses
- Profitability
- Budgets
- Forecasts
- Cost trends
Operations Reporting
Operations teams can track:
- Inventory
- Productivity
- Delivery performance
- Supply chain metrics
- Operational costs
- Resource utilization
This flexibility makes Power BI useful across different areas of an organization.
Power BI Consulting Services for Better Reporting
Although Power BI can simplify reporting, developing an effective business intelligence environment requires planning.
This is where Power BI consulting services can help.
A professional consultant can help organizations identify:
- Business reporting requirements
- Important KPIs
- Data sources
- Data architecture
- Security requirements
- Dashboard requirements
- Governance considerations
The goal is to make sure the Power BI environment supports actual business objectives.
Instead of asking, “What dashboards can we build?” organizations should ask, “Which business decisions need better information?”
That difference can have a significant impact on the success of a Power BI project.
Power BI Development Services for Custom Dashboards
Not every business needs the same dashboards.
A retailer may need inventory and sales reporting.
A manufacturer may need production and supply chain analytics.
A financial services organization may require detailed financial reporting.
Power BI development services can help create dashboards and reports based on specific business requirements.
Custom development can include:
- Data modeling
- Data transformation
- Data integration
- Interactive dashboards
- Custom reports
- KPI development
- Performance optimization
This can make Power BI more closely aligned with an organization’s existing processes.
Power BI as a Service for Businesses Without Large BI Teams
Some organizations want professional analytics capabilities but don’t have a large internal business intelligence team.
Power BI as a Service can provide access to specialized Power BI expertise through an external service model.
Depending on the provider, this can include:
- Consulting
- Development
- Dashboard creation
- Data integration
- Implementation
- Optimization
- Ongoing support
This approach can be particularly useful for small and mid-sized businesses that want to expand their analytics capabilities without building a large internal team.
Power BI Managed Services for Ongoing Support
Creating dashboards is only one part of business intelligence.
Organizations also need to maintain their Power BI environment as business requirements change.
Data sources can be updated. New KPIs can be introduced. Reports may need optimization, and users may require support.
Power BI managed services can provide ongoing assistance with:
- Dashboard maintenance
- Performance monitoring
- Troubleshooting
- Data refresh issues
- Report updates
- Optimization
- User support
- New report development
This can help organizations maintain a reliable reporting environment over time.
Power BI and Reporting Services: Moving Beyond Spreadsheets
Spreadsheets remain useful for many business tasks, but relying on them for every reporting requirement can become difficult as an organization grows.
Power BI and reporting services can provide a more centralized approach to business analytics.
Instead of creating separate spreadsheets for every department and reporting period, businesses can develop dashboards around common KPIs and business objectives.
This can help create:
- More consistent reporting
- Easier data exploration
- Better visibility
- Faster access to information
- Reduced manual reporting
The objective isn’t necessarily to eliminate spreadsheets.
It’s to use the right tool for the right reporting requirement.
How to Choose a Power BI Services Company
Choosing a reliable Power BI services company is important when developing a business intelligence solution.
Before selecting a provider, consider the following:
1. Technical Expertise
Does the provider understand Power BI development, data modeling, integration, security, and performance?
2. Business Understanding
Can the provider understand your KPIs and the decisions your reports need to support?
3. Custom Development
Can they build reports around your business instead of relying entirely on generic templates?
4. Ongoing Support
Do they provide Power BI managed services after implementation?
5. Communication
Can they explain technical concepts clearly to business stakeholders?
A strong provider should combine technical expertise with an understanding of business objectives.
Why Choose Soft-Korner for Power BI Services?
At Soft-Korner, we help businesses turn complex information into practical, easy-to-understand business intelligence.
Our Power BI services can support organizations looking for:
- Power BI consulting
- Power BI development
- Interactive dashboards
- Custom reporting
- Data integration
- Data modeling
- KPI dashboards
- Power BI managed services
- Business intelligence support
We focus on understanding the business problem before developing the reporting solution.
Whether you’re a growing business, mid-sized organization, or larger enterprise operating in the USA or Canada, our goal is to help you create reporting solutions that make your data more useful.
How to Simplify Your Reporting With Power BI Service
If your organization is considering Power BI Service, start by identifying the reporting processes that create the most challenges.
Ask:
- Which reports take the longest to prepare?
- How many systems contain business data?
- Which KPIs are most important?
- How often do reports need to be updated?
- Which teams need access to dashboards?
- Where are reporting errors occurring?
- Which decisions could benefit from better data?
Once these questions are answered, you can prioritize the highest-value reporting requirements.
Start small, demonstrate value, and expand the Power BI environment as your organization’s needs grow.
Final Thoughts
Effective business reporting isn’t about presenting more numbers.
It’s about making important information easier to understand and use.
Power BI Service can simplify data visualization and reporting by transforming complex information into interactive dashboards, connecting data sources, centralizing KPIs, reducing repetitive reporting tasks, and improving collaboration.
For businesses in the USA and Canada, these capabilities can help create a more flexible and scalable approach to business intelligence.
However, the best results come from combining the technology with the right strategy and expertise.
Whether you need Power BI consulting services, Power BI development services, Power BI as a Service, or Power BI managed services, an experienced partner can help you build a reporting environment around your organization’s actual goals.
Soft-Korner can help you turn complex business data into clear, actionable insights with Power BI solutions designed for smarter reporting and decision-making.